Tracking Usage and Performance with the Dashboard
The Dashboard presents key information about performance and usage activity. On the spot, and in real time, you’ll get a good understanding of the activity on your Algolia account - like knowing what your users are doing, and how fast, and what sort of API operations are being performed. All of this provides an open window into your application’s API usage.
We’ve designed this information to help you in two significant ways. First, to help you tweak your data and index configurations to achieve greater relevance, speed, and efficiency. Secondly, to offer you a simple way to monitor the billable activity of your account.
This tutorial will focus on the Dashboard Section and its tabs. If you are not familiar with the Dashboard, please take a look at our Dashboard Overview tutorial.
We encourage you to experiment with different searches and indexing operations as you go through this tutorial, to help make these metrics concrete and meaningful. You can do this with your API or within the Indexing section of the Dashboard. Ultimately, the goal is to give you more control over the Algolia search engine.
Performance Metrics
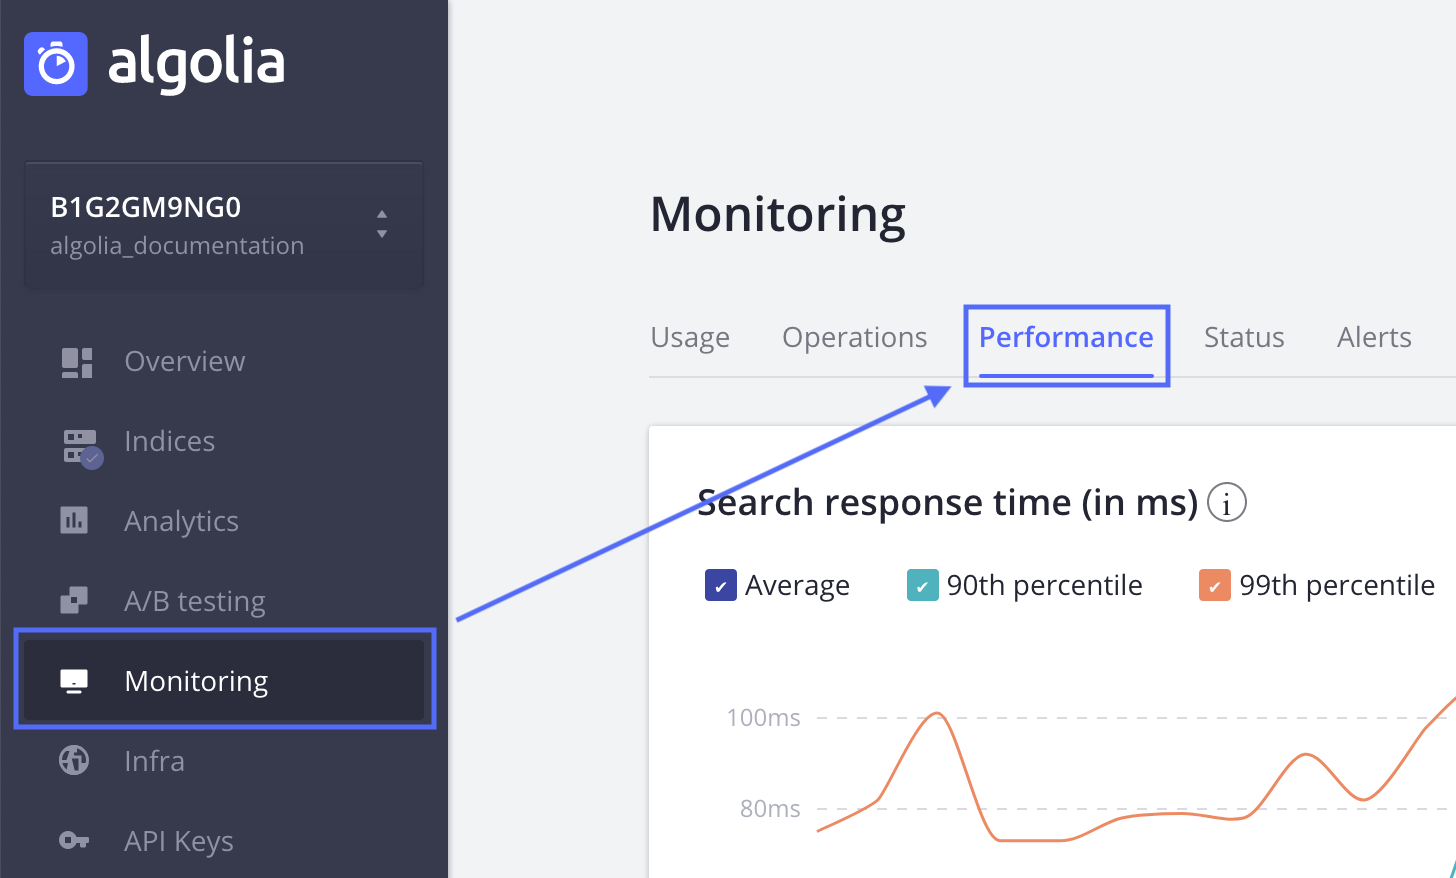
Let’s start with performance. Click on the Monitoring section in the sidebar, then the Performance tab.
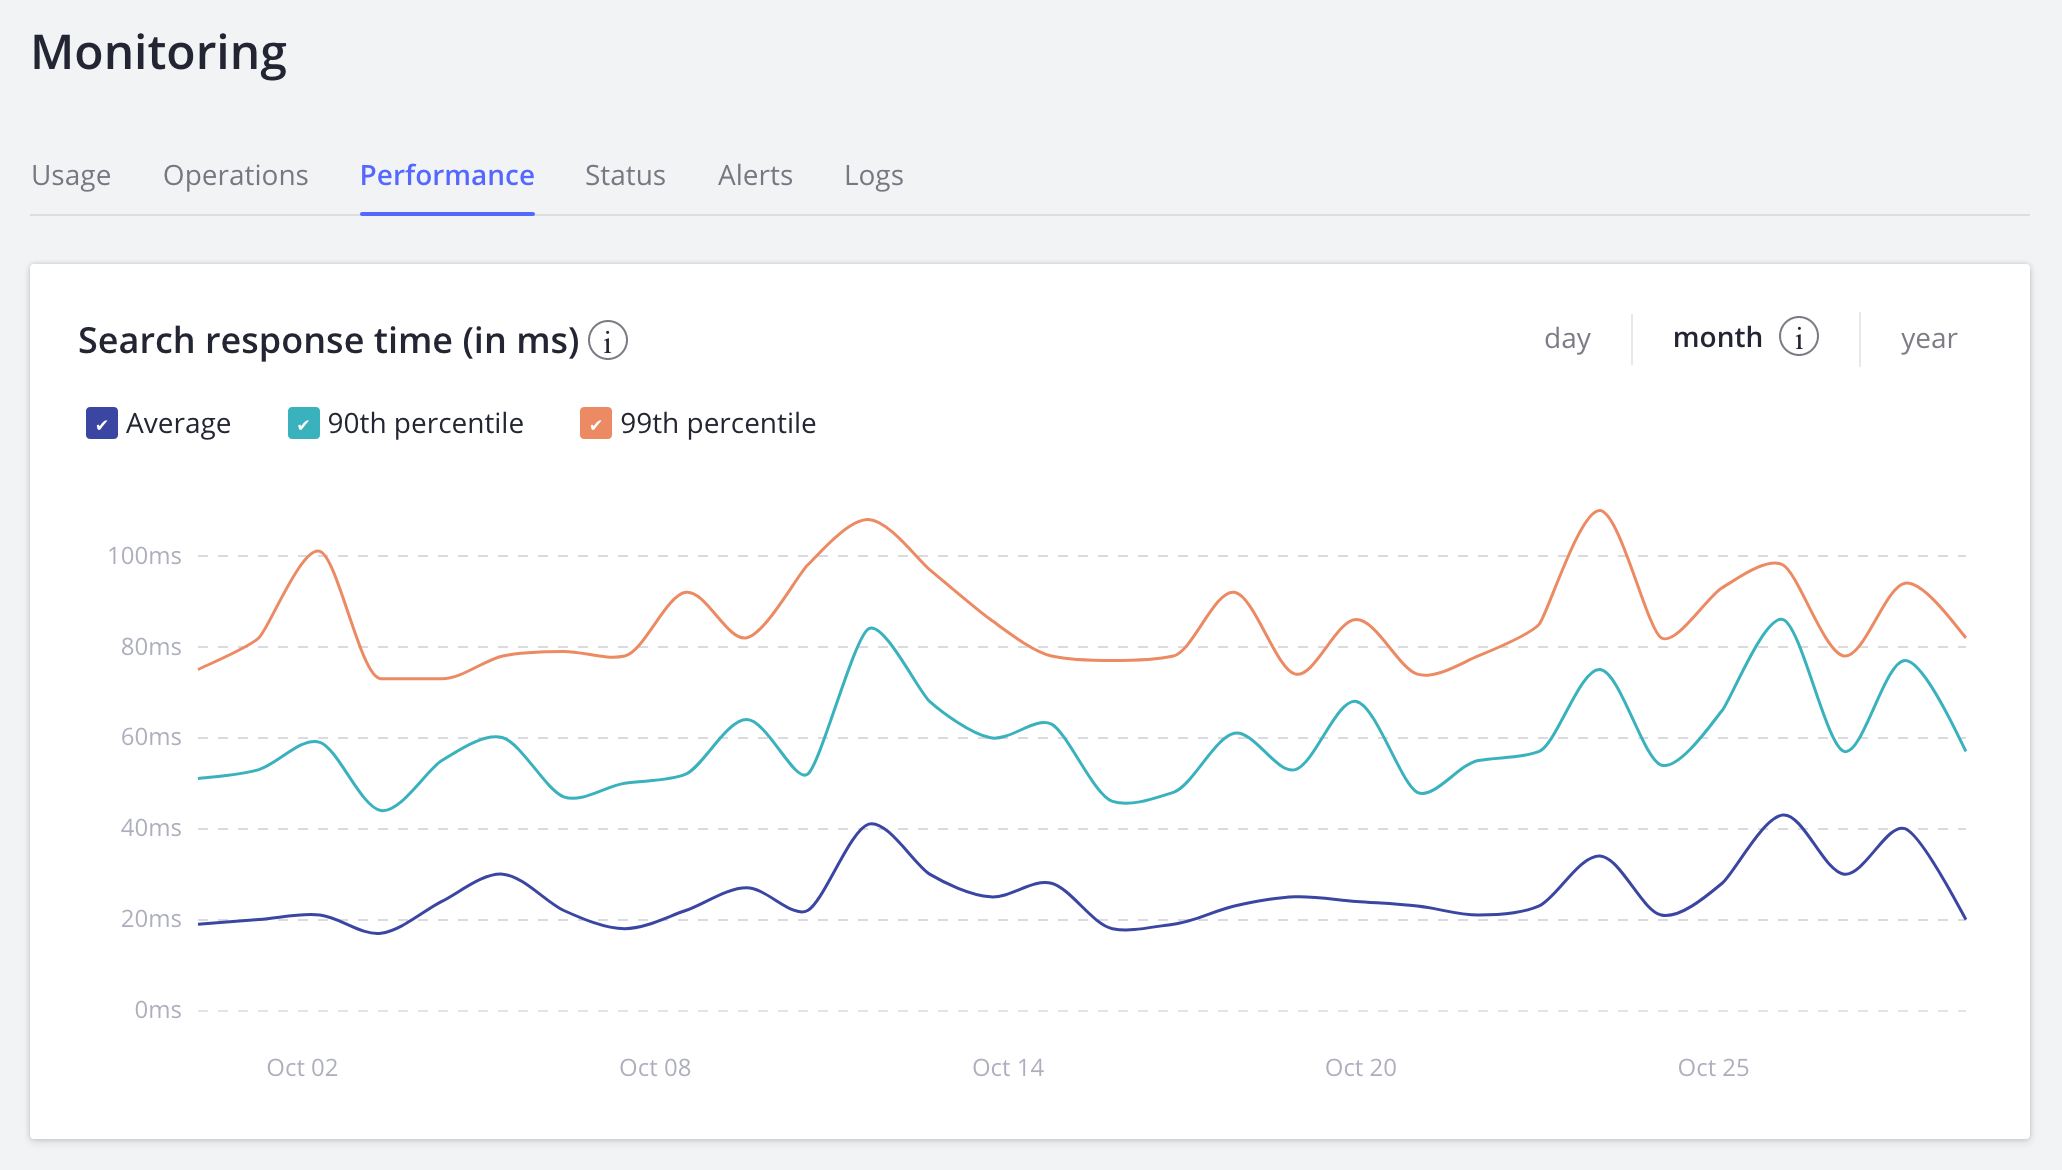
On this page you’ll see a full view of the number and speeds of your search operations. We break these figures into 90% and 99% percentiles. We also provide a graph that traces the daily figures, divided into hours, days, and months, for up to one year (1 month = 30 days, and 1 year = 365 days). Note that the speeds measured here are the times it takes the Algolia server to process a search request.
We also give you a Queries per Second view, which can be used to check whether large user search activity has any impact on performance.
Measuring Speed
We measure performance in milliseconds. A larger value might indicate a performance problem. Additionally, since we are only measuring the speed of the Algolia servers, you will need to add network latency and front-end display times to measure the full user experience. We always recommend that total time, from keystroke to display, be less than 100ms, as this delivers a real search as you type experience. Thus, with this 100ms benchmark, and an average latency of ~70ms, the engine’s processing time should be no greater than 30ms, and ideally a lot lower.
Usage Activity
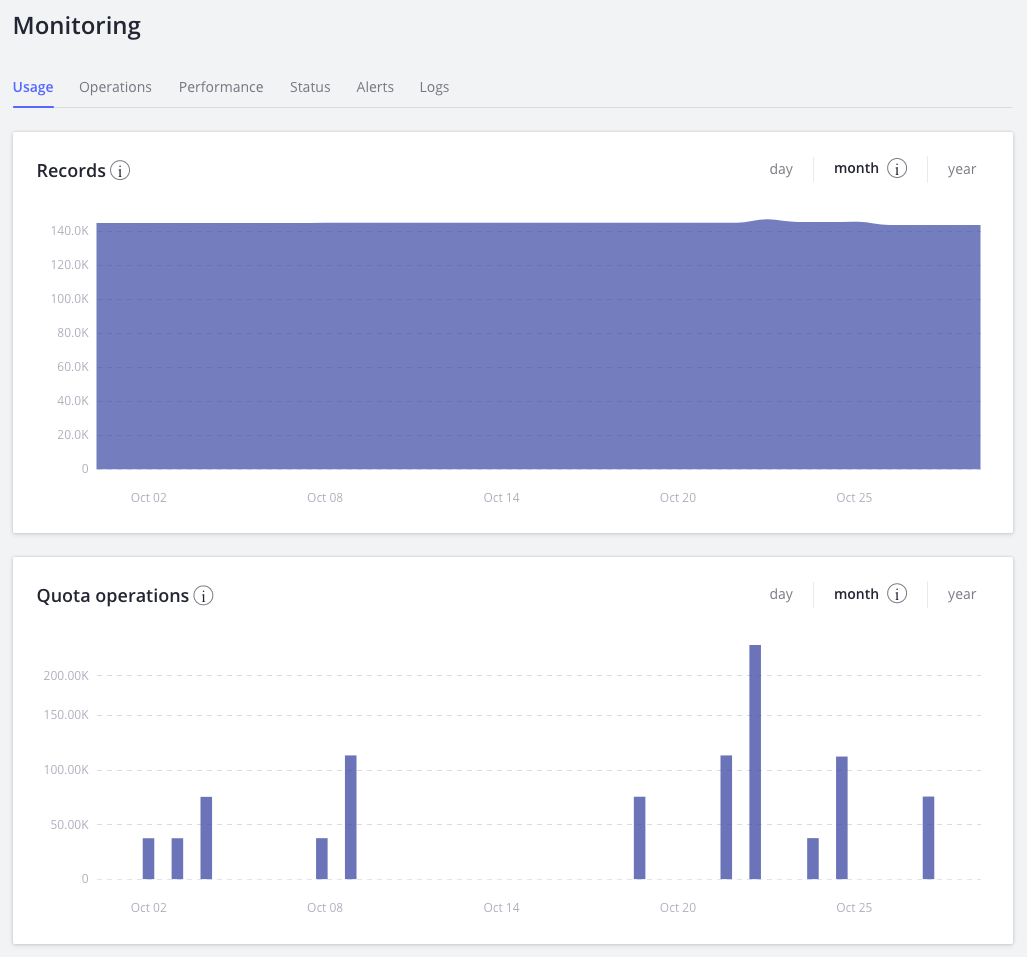
You can see your total number of records, as well as the number of search and indexing operations performed during the current billing cycle, under the Usage tab. The Records graph shows your total number of records. Whether you have a monthly or annual subscription, these figures will always reflect your application’s monthly usage. which will be used to generate an invoice at the end of your billing cycle.
The Records & Operations Tab
In this section, you have a variety of timelines that trace your API usage. These too are broken down by hour, day, and month, for up to a year. The first of these displays the fluctuations of your total indices size over a fixed period of time. The remaining timelines display the execution count of nearly every operation within our API. These latter timelines are divided into six kinds of operations - Search, Indexing, Record, ACL, Synonyms and Query Rules - each of which are further divided into their associated API function calls.
As an example, let’s look at the “Records Operations” graph. On the top left, you see 5 record-based operations: Add, Delete, Partial update, Update and Delete by Query.
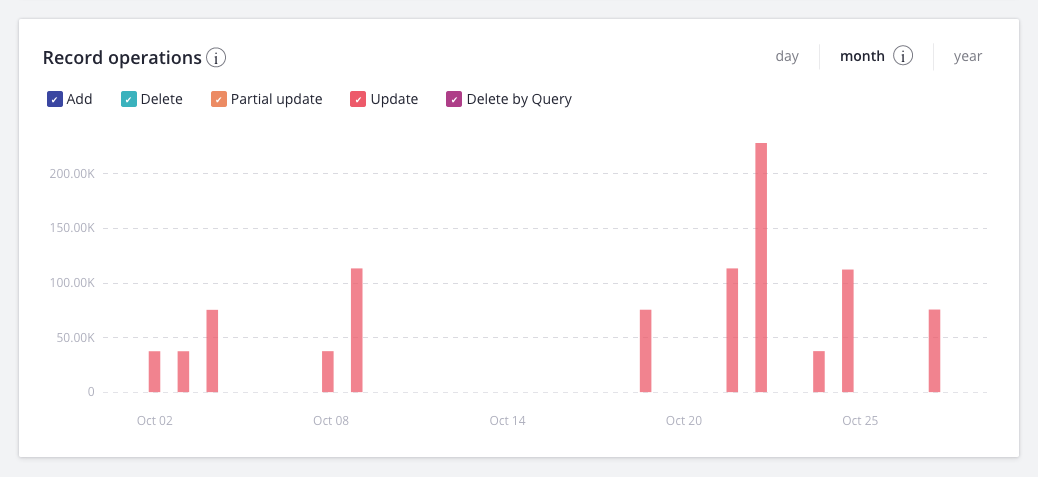
To make things easier, you can also hover your mouse over the timeline to get a tooltip snapshot of all related operations for that particular hour, day, or month.
Note that usage statistics do not include indexing operations on replicas, because keeping replicas in sync is done internally by the Algolia engine.
API Status Tab
Up to this point, we’ve been discussing the performance and activity of your API usage. Now we move to infrastructure, concerning the latency and processing speeds of your servers, clusters, and DSNs.
Latency Averages
The first page provides a graphical view of average latency times, with a coloring system to immediately alert you to the working state of your clusters and servers. If you have more than one cluster, or any DSNs, these will be viewable as separate graphs. To see clusters or DSN statistics independently, click on the corresponding tab under the Your Server section.
The latency figures on this first page are a total average of the individual averages that we discuss below. You can hover over the graph’s timeline and trace the average latency, calculated every 10-minutes.
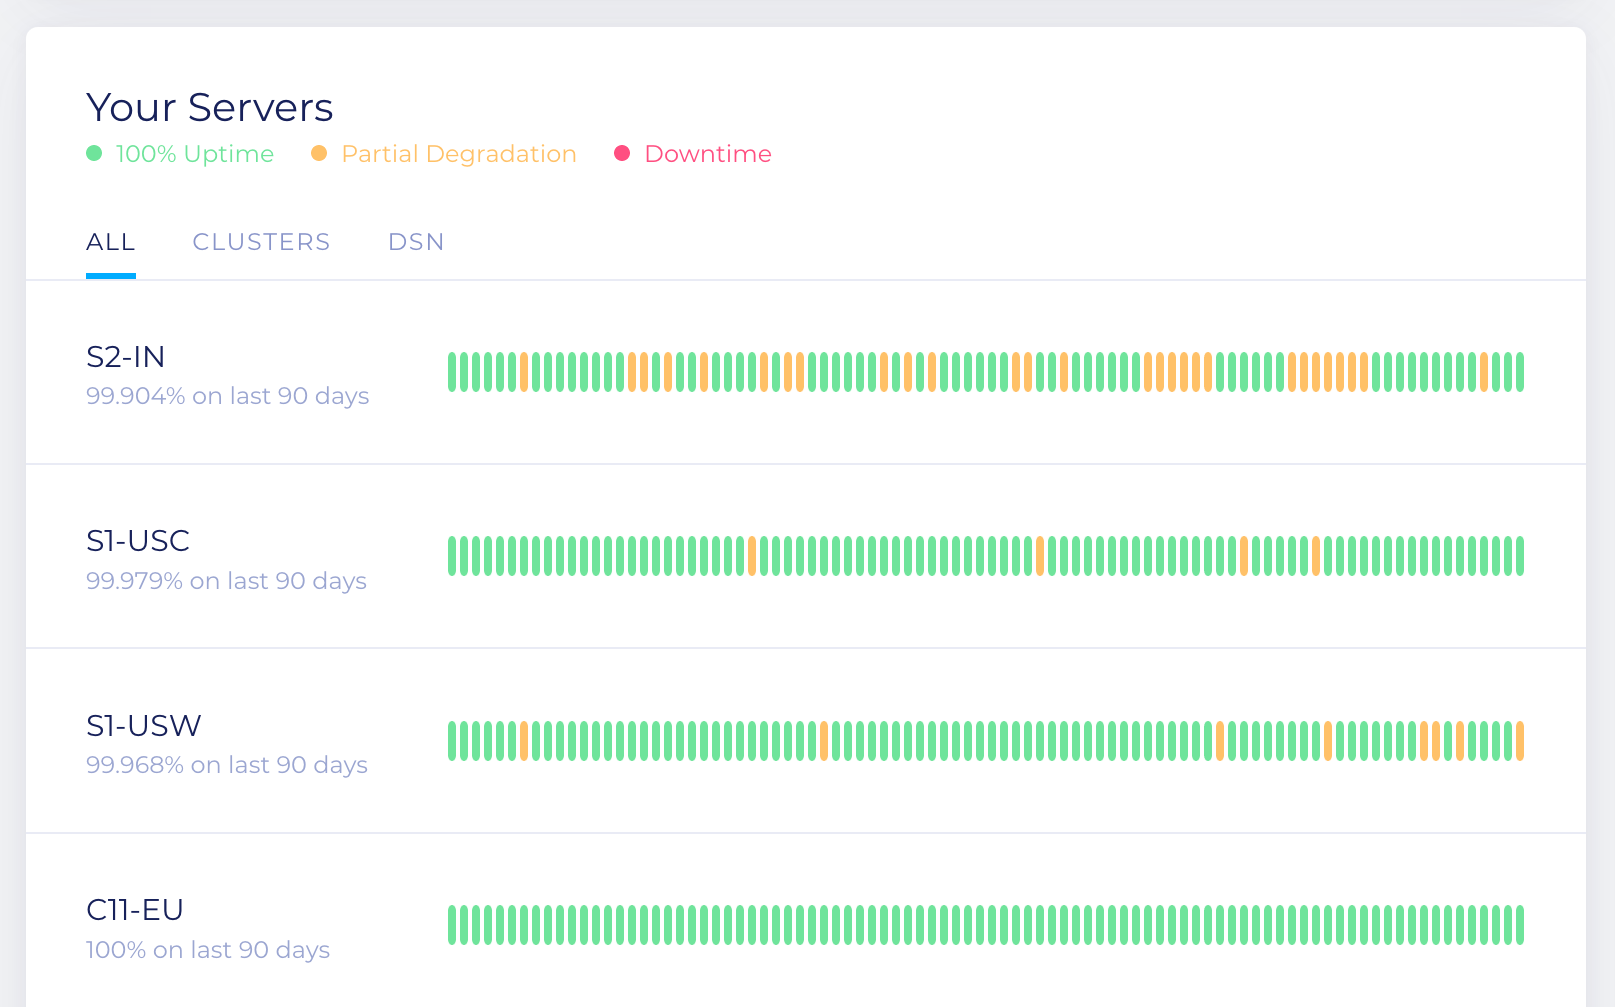
Colors
A note on the coloring system. Algolia uses clusters to process every indexing and search operation. This is primarily done for redundancy reasons: if one server goes down, there is no impact on search and indexing operations, the cluster remains at 100% availability (green). Furthermore, if a second server goes down, the remaining server still processes search requests (100%), but no indexing operations (yellow). In this situation, indexing operations are queued, to be executed only after the cluster returns to its green state. Finally, if all 3 servers are down, the cluster is down and the indicator turns red.
As already mentioned, our measures are done in 10-minute intervals. So a cluster’s availability (color) can change every 10 minutes.
The Worldwide Reachability Map
To get to the map, you can go to the API Status page. Here, you come to a new page with a wealth of detail. At the very top, you’ll see the current status of your cluster, using the same coloring system described above. Just below that, you’ll see the Worldwide Reachability map.
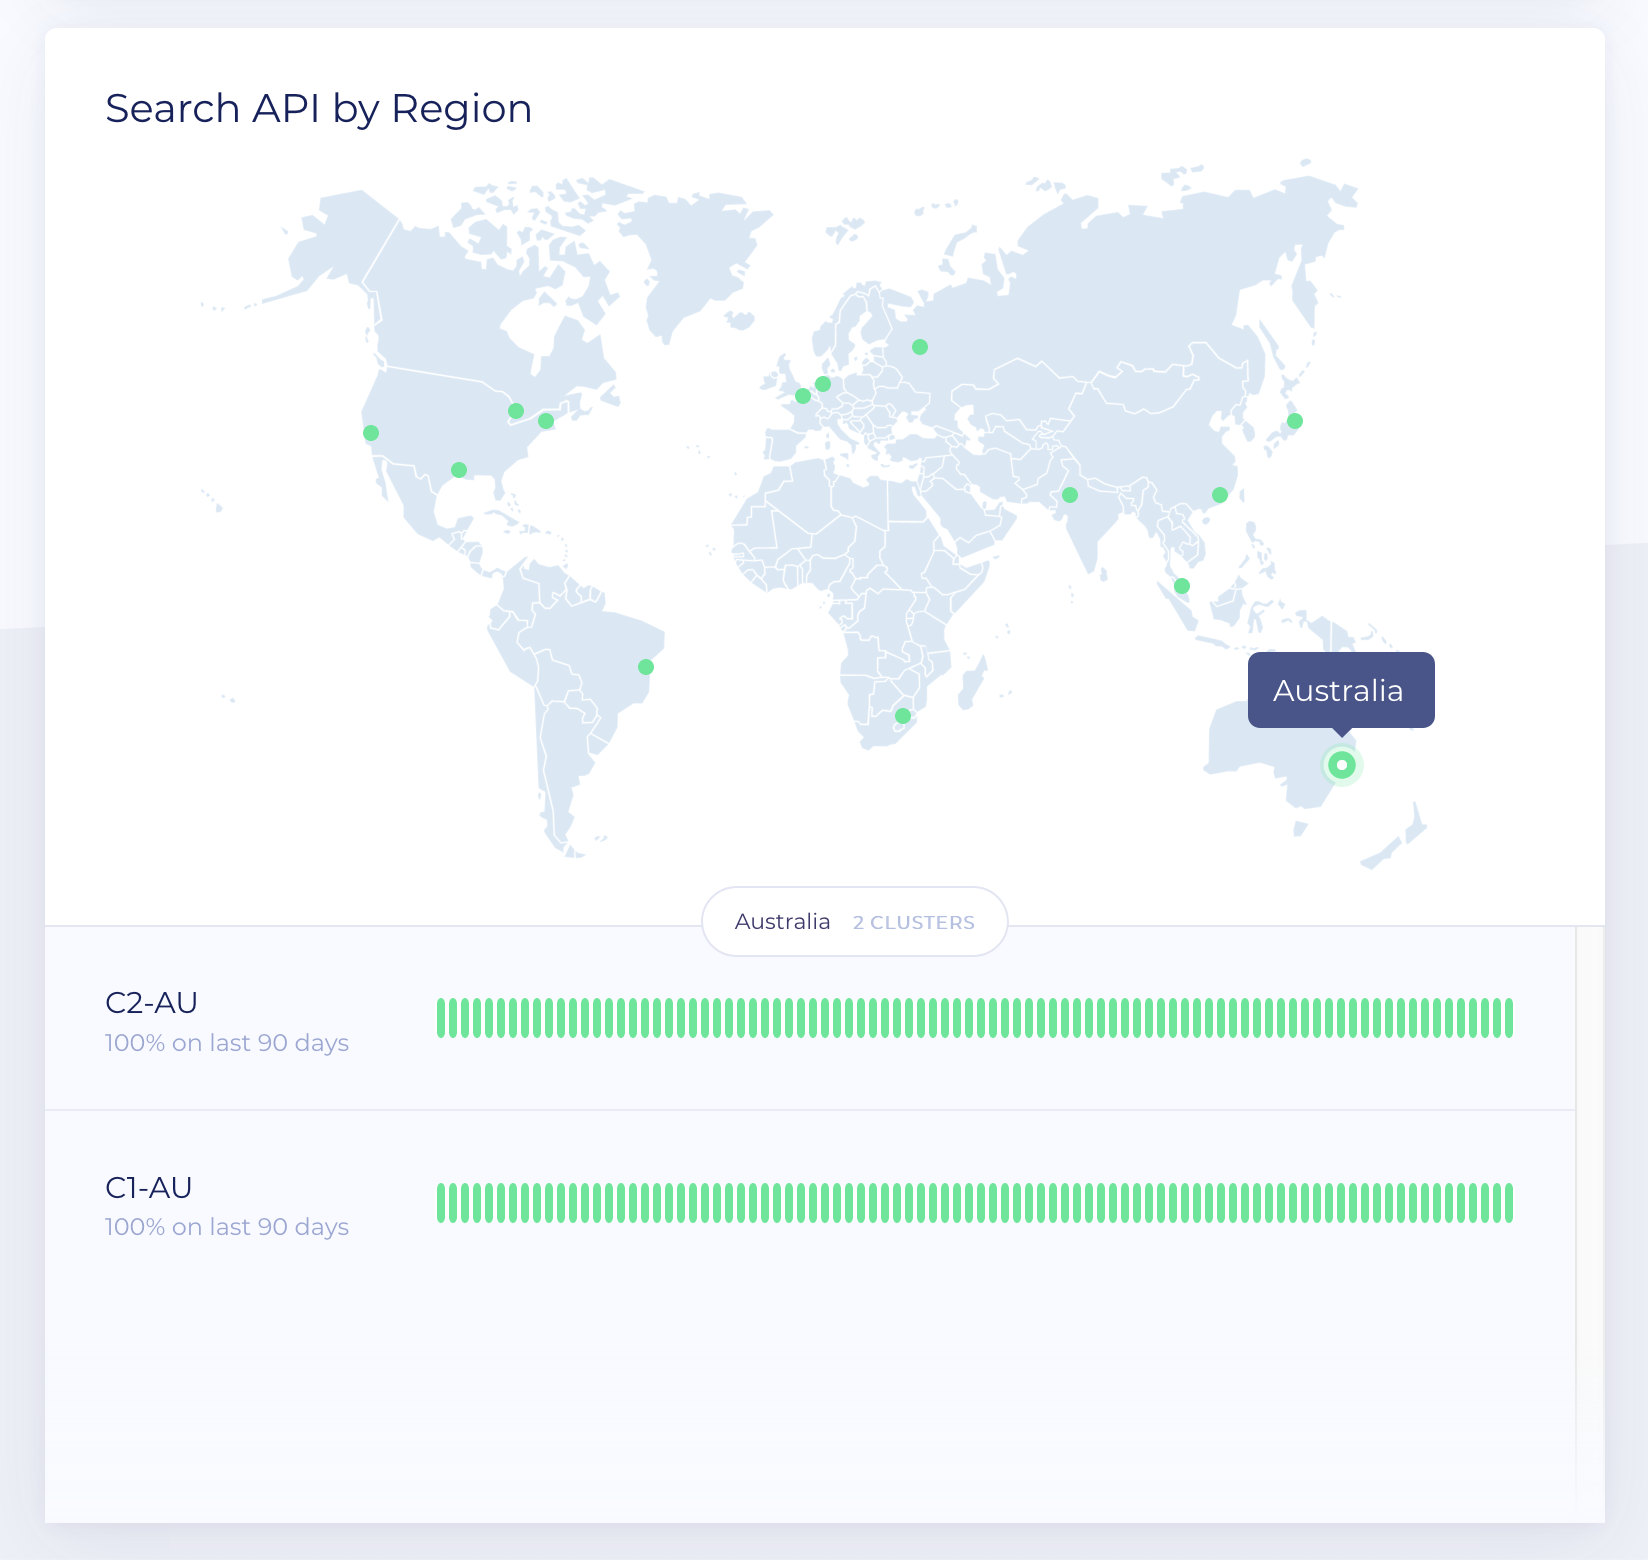
This map displays the worldwide location of our probes. To understand our latency calculations, you’ll need to understand what these probes do. Algolia currently has 30 computers (probes) strategically positioned all over the world to measure regional latency speeds. How this works is as follows. Each probe performs the following 2 operations.
- Sends a signal to every server in every cluster, and measures how long it takes to receive a response. This is the Ping test.
- Makes a simple API request and also waits for a response. This is called the API test.
The ping test is designed to test simple computer-to-computer speeds. The API test goes a step further and tests not only the response time but also the functioning state of the server. For example, if a server cannot perform a simple indexing operation, or if the processing time slows down the response, there is a problem.
Some other features
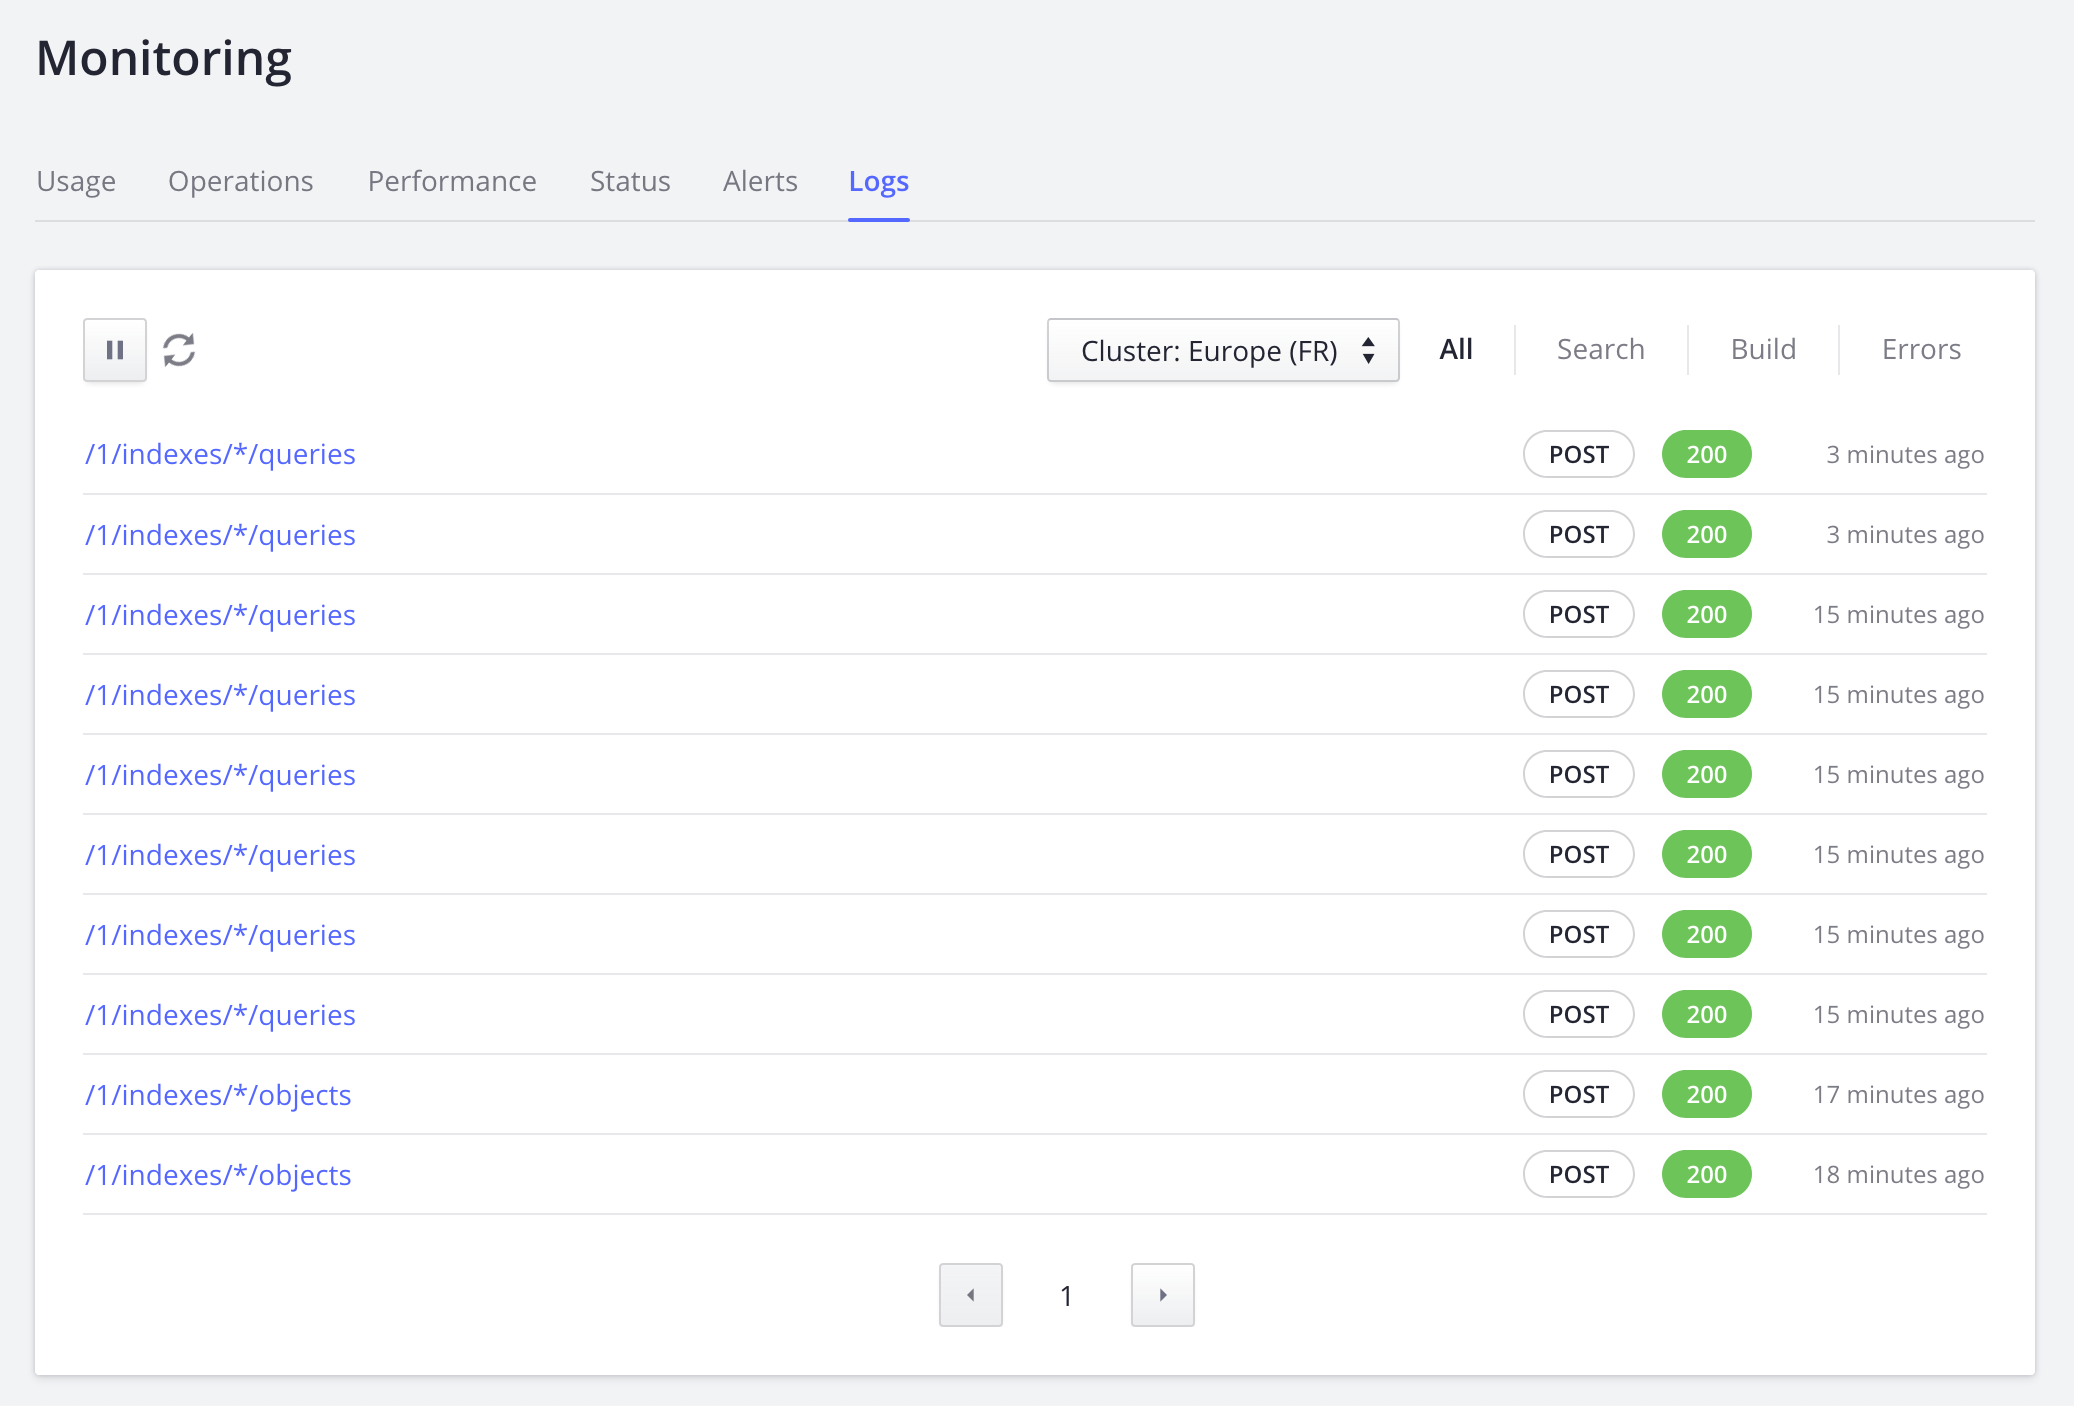
Latest Operations
In the Logs tab, you can watch as operations are being executed on our server, in a continuous, real-time scroll.
Alerts
We have several kinds of Alerts.
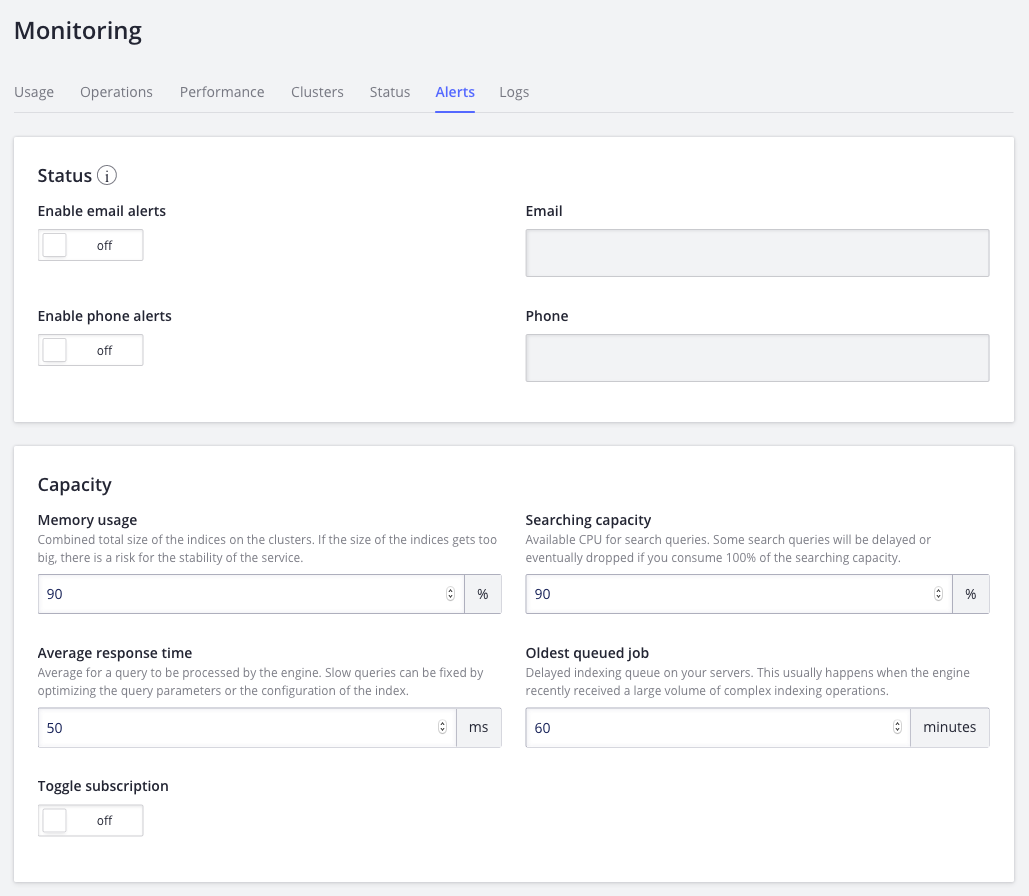
Status, where you set up 2 emails to receive incident reports as they occur. The kinds of incidents reported are discussed above in API Status Tab.
Capacity, where you set up one or more Capacity Alerts to warn you before your servers overflow on memory and CPU usage. As you can see, the threshold for each metric can be configured. Take a look at our tutorial on How to set up capacity alerts.
Only Enterprise customers with dedicated servers can receive capacity alerts.
