Capacity Alerts
Enterprise customers with dedicated servers can receive capacity alerts.
Capacity alerts warn you when something is about to go wrong. This is clearly useful in helping you anticipate and avoid serious troubles. But it can also reveal the need for optimization, such as in how you define your settings and search parameters, or in how you structure and push your data.
There are many considerations, and we can help you find solutions.
What do we monitor?
The alerts are based on several kinds of server-side metrics.
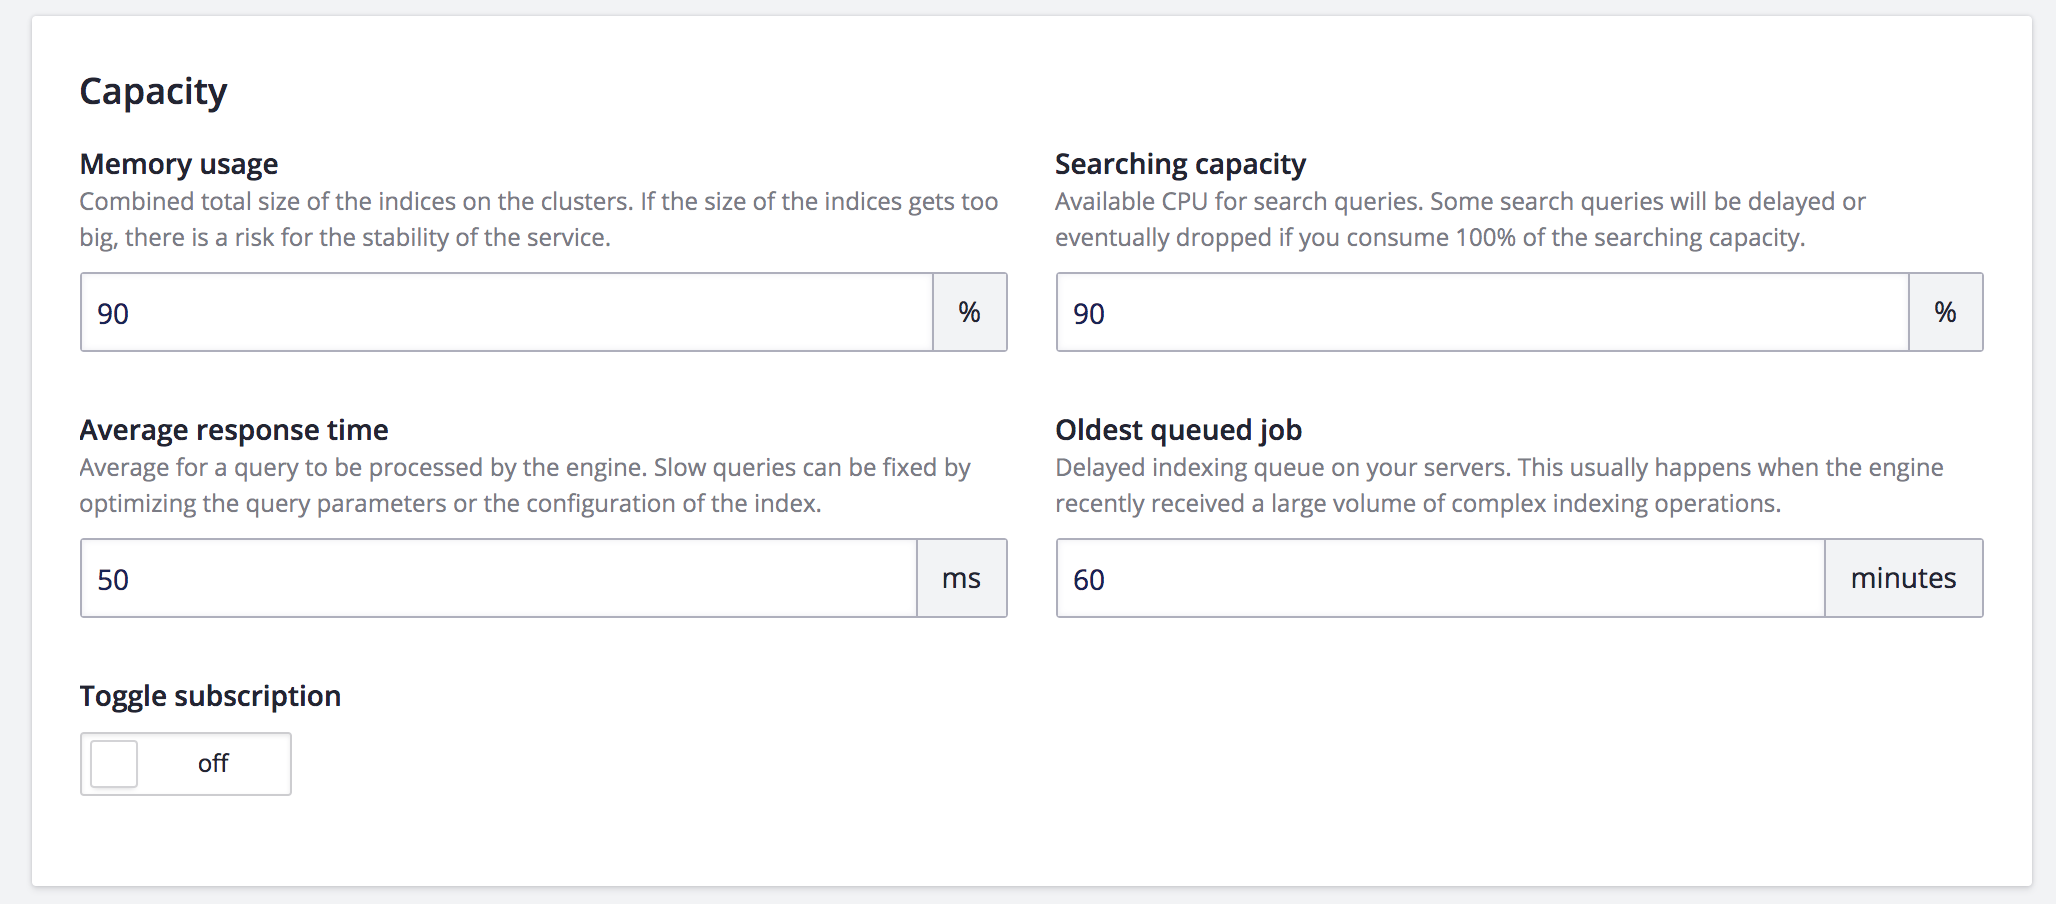
Memory usage
Combined total size of the indices on the clusters. If the size of your indices gets too big, there is a risk of destabilizing the service.
Searching capacity
Available CPU for search queries. Some search queries will be delayed or eventually dropped if you consume 100% of the searching capacity.
Average response time
Average time for a query to be processed by the engine. Slow queries can be fixed by optimizing the query parameters or the configuration of the index.
Oldest queued job
Delayed indexing queue on your servers. This usually happens when the engine receives a large volume of complex indexing operations.
How to subscribe to and configure capacity alerts
Every collaborator can subscribe to receive capacity alerts for each application. This can be done via the dashboard, from the Alerts tab.

As you can see, the threshold for each metric can be configured.
The default values should be sufficient for most applications, so we recommend not changing them.
Feel free to reach out to your Solutions Engineer, CSM, or send us an email at enterprise@algolia.com if you need help with this feature.
