Create and Run an A/B Test
On this page
Set up and run the A/B test
You will only need to use the Dashboard to create a new test. Here’s what it looks like:
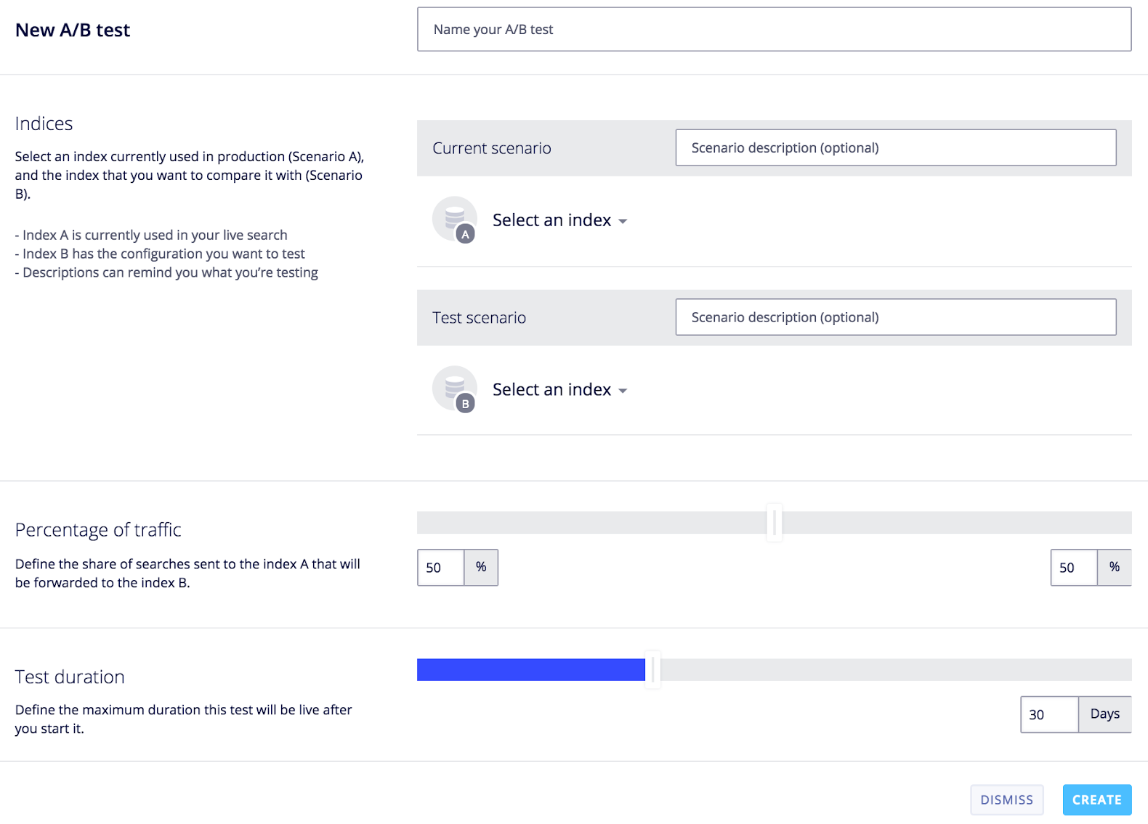
Set up the test
Some of the instructions below apply only to A/B testing with two different indices. You can ignore those parts if your are doing A/B testing on a single index.
You need to provide 4 pieces of information to get a test up and running.
-
Naming the test. When creating your test, always use descriptive names to more easily understand the purpose of the test. If you are comparing sorts - most-viewed vs. most-sold - a good name would be “Which is better - most-viewed or most-sold?”.
-
Choosing the A and B indices. The A is the control index, your main index. The B is your comparison index. The A and B indices are here referred to as scenarios, each representing a particular way of configuring your index. You can set a description for each index; again make it readable, so as to understand at a glance the nature of the scenario.
-
Allocating a percentage of traffic to A and B. You might want 50% of your searches to use index A and the other half B. Or you might want B to be used less often, especially if you are unsure about your new change. In that case, you can allocate B to only 30% usage, making the split 70/30.
-
Choosing a duration. The correct duration is determined by the math: reliable results need a certain minimum quantity of data. This minimum amount is determined using [statistical significance]. You can choose to run your test from 1 to 90 days. Normally, you’ll set it to a max duration which you estimate is more than enough time to reach confidence. What you choose depends on your average usage: low-usage sites will need to run their tests longer than high-usage websites.
Press Go
Pressing “Create” in this context means Go. Once a test is created, it begins to run immediately. At this point, you have only 2 remaining options: stop it before the planned duration (but be careful, you cannot restart it!), or wait until the planned duration is completed. The point here is that if we were to enable pausing and restarting, we would be allowing you to undermine your own tests: full, continuous testing, with no test-researcher interference, is the norm for this kind of testing.
View the results
You can view a test while it is running or after it has completed. The results are presented in tabular form, making it easy to see at a glance which index is performing best. This table shows the scores, how many users are testing, and how reliable the test is (confidence percentage). Let’s take a look at an example.
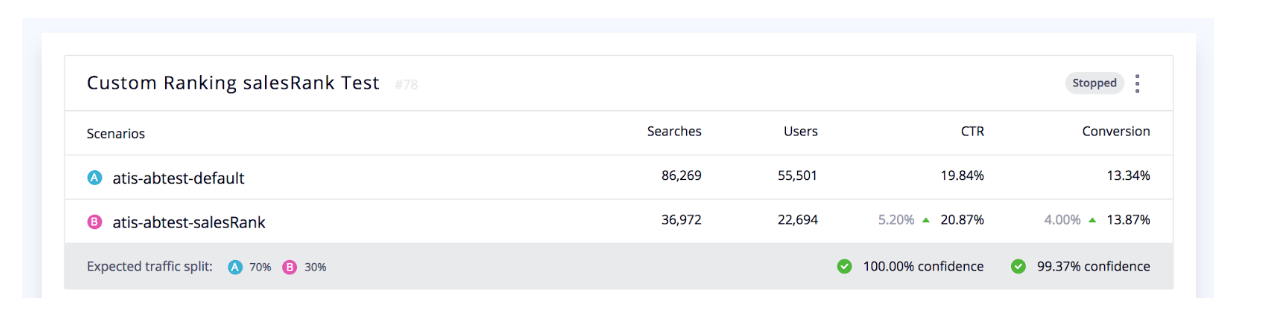
Each test is a block of 5 rows.
-
Descriptive elements. You will see the titles and descriptions of your scenarios, as well as the allocation and duration choices you made in creating the test.
-
The Menu. On the first row, top right, you can stop a test. You can also delete the results.
-
Status. To the right of the menu appears the status of the test. Possible statuses are:
Newfor a recently created test.StoppedorFinished.Running, along with how many days are left.
-
Data Columns/Rows.
-
Searches and users. These figures are important, as they are used to gauge the sufficiency of the data and the fairness of the allocation.
-
CTR and Conversion rates. These figures create the comparisons. At a glance, you can see whether A or B is higher or lower.
-
The difference. The red or green arrow + percentage number to the left of the rates can help clarify the comparison. The comparison is not a simple subtraction: a percentage difference between the 2 scenarios offers a better comparison. In this image, the B scenario appears to be doing better in both categories (5.2% better in CTR and 4% better in Conversion rate). There will be times when CTR is better but Conversion is worse (=red arrow).
-
-
Confidence percentage. The final row contains the confidence percentage, telling you when a test has reached its threshold of reliability (ie, statistical significance. See below.). 95% is the minimum before you can rely on the results. Sometimes, only one of the tests (CTR) will be confident, the other still below confidence. It will be up to you in all cases to see how long you wait before stopping the test.
For more about these numbers, see interpreting results as well as how we calculate the scores.
Note: Test Results are updated every 5 minutes. While your users are using your website, sending you in real time their analytics data, the Dashboard itself will only refresh its data once every 5 minutes. You will therefore not be watching changes in real-time. This should be fine, because a test usually runs for days and weeks, and so you will never need to see changes in real-time.
Test Statuses
A test can be in 3 states:
- Running
- Stopped or Finished
- In both cases: the test is over and cannot be restarted. As a result, your application is back to normal: index A will perform as usual, receiving 100% of all search requests.
- When you stop a test, all associated metadata and metrics are still stored, and the test remains on the Dashboard.
- Deleted
- When a test is deleted, all associated metadata and metrics are still stored, and it disappears from the Dashboard.
Interpret the results
See also math and statistics methodology.
-
We don’t interpret the results for you. What you consider good or bad is entirely dependent on your website and business. You need to always compare the cost of an improvement with its benefits. A 4% improvement of CTR might not be convincing or profitable enough to change. It’s the same with conversion rates: we do not tell you what a good conversion is, so likewise, we will not tell you what kind of improved conversion is a good result. That said, because changing settings or pushing different data is usually a low-cost option, you will almost always implement an improvement.
-
Minimum number of searches. Although we do not recommend doing this, you can stop your tests whenever you want. You can analyze results on as little or as much data as you want. You can, in other words, ignore the confidence indicator. But this is inadvisable. The indicator is there to tell you when your data is statistically sufficient. There is underlying math behind this indicator. We suggest that you respect this indicator, as it uses a methodology that ensures confidence and reliability. In other words, respecting this indicator will help you avoid jumping to conclusions based on skewed or insufficient data.
-
Small differences in scores can mean big differences in your business. A small increase in CTR or Conversion can mean a large jump in sales, or more traffic, or better client relations, more customer success and fidelity. So once a test has received sufficient usage, and the conclusion is positive for B, don’t hesitate to act on those results!
-
But be careful with small percentage differences, they can quickly switch in the opposite direction. You do not want to jump to conclusions based on small differences - not yet, that is. Let a test run to completion, to full duration, or at least until it reaches 95% or more confidence. Wait to see a more definitive percentage breakdown. The percentages can change depending on weekend rates, or special occasions, etc., so you need to be careful with the results. A small difference in percentage between today and tomorrow can result in an entirely different conclusion.
Best Practices
-
Test before going live. Be careful about breaking anything, like the UI, or relevance. Even small changes can break the UI or the overall user experience. For example, making a change that affects facets can fail the UI facet logic. Or changing a simple ranking on B can make the search results so bad that users of the B index will have terrible results. This is not the purpose of A/B Testing. B should theoretically be better, and if not, at least as good as A.
-
Don’t change the indices during the tests. Do not adjust settings during testing because this will taint the test’s results, rendering the tests unreliable. And if you need to update your data, this should be done synchronously between A and B. Data updates should be kept to a minimum, done only in the most necessary cases. Changing data or settings while a test is running can (a) break your UI and users’ search experience, and (b) undermine the reliability and conclusions of the tests.
-
Don’t use the same index for multiple A/B Tests. You cannot use the same index in more than one test at a time. You will get an error.
-
(bears repeating) Make only small changes.
-
(bears repeating) Be careful of your account’s size limitations when creating new B replicas.
The API
While everything you need to do for A/B Testing can be done via the Dashboard, there are a few scenarios that could benefit from using the API instead.
-
You might want to run the same test across many indices, for example, if you have many websites using the same kind of indices but with different data. With the API you can create multiple tests more easily.
-
You are already doing a lot of API-related activity on your indices, for example, if you have already built your own admin console to manage your search solution. In that case, while not necessary, you might want to continue using the API to manage your tests.
-
You might want your backend to trigger tests based on data changes, or create feedback loops based on your analytics, as used in machine-learning. This is clearly an advanced method of managing product-line changes or industry trends, and should be done carefully.
These are really very unique use cases. We expect the majority of our clients will be using the Dashboard to manage their testing.
Note, to use the API, you will need to use the following API Key ACLs:
- A/B Test creation/deletion - setSettings ACL on all indices
- A/B Test analytics - analytics ACL on all indices
