Why is the sum of Max QPS values smaller than the Global Max QPS?
Because the Global Max QPS is calculated for all servers on your account while the Max QPS applies only to individual servers. As a result, we do not use the Max QPS to calculate the Global QPS.
QPS Calculations
The Max QPS is calculated as follows: Which second, within a given time period, has the highest number of queries (See formula here). Do this for each server.
The Global Max QPS is calculated as follows: the same formula: Which second, within a given time period, has the highest number of queries. But do this for the entire account (for all servers).
The “global” is therefore not about accumulating the values for individual servers; it’s about finding which moment for the whole account has the most activity.
In the example below, you will see how, in following these 2 separate calculations, we can come up with 2 different and unrelated values.
Example
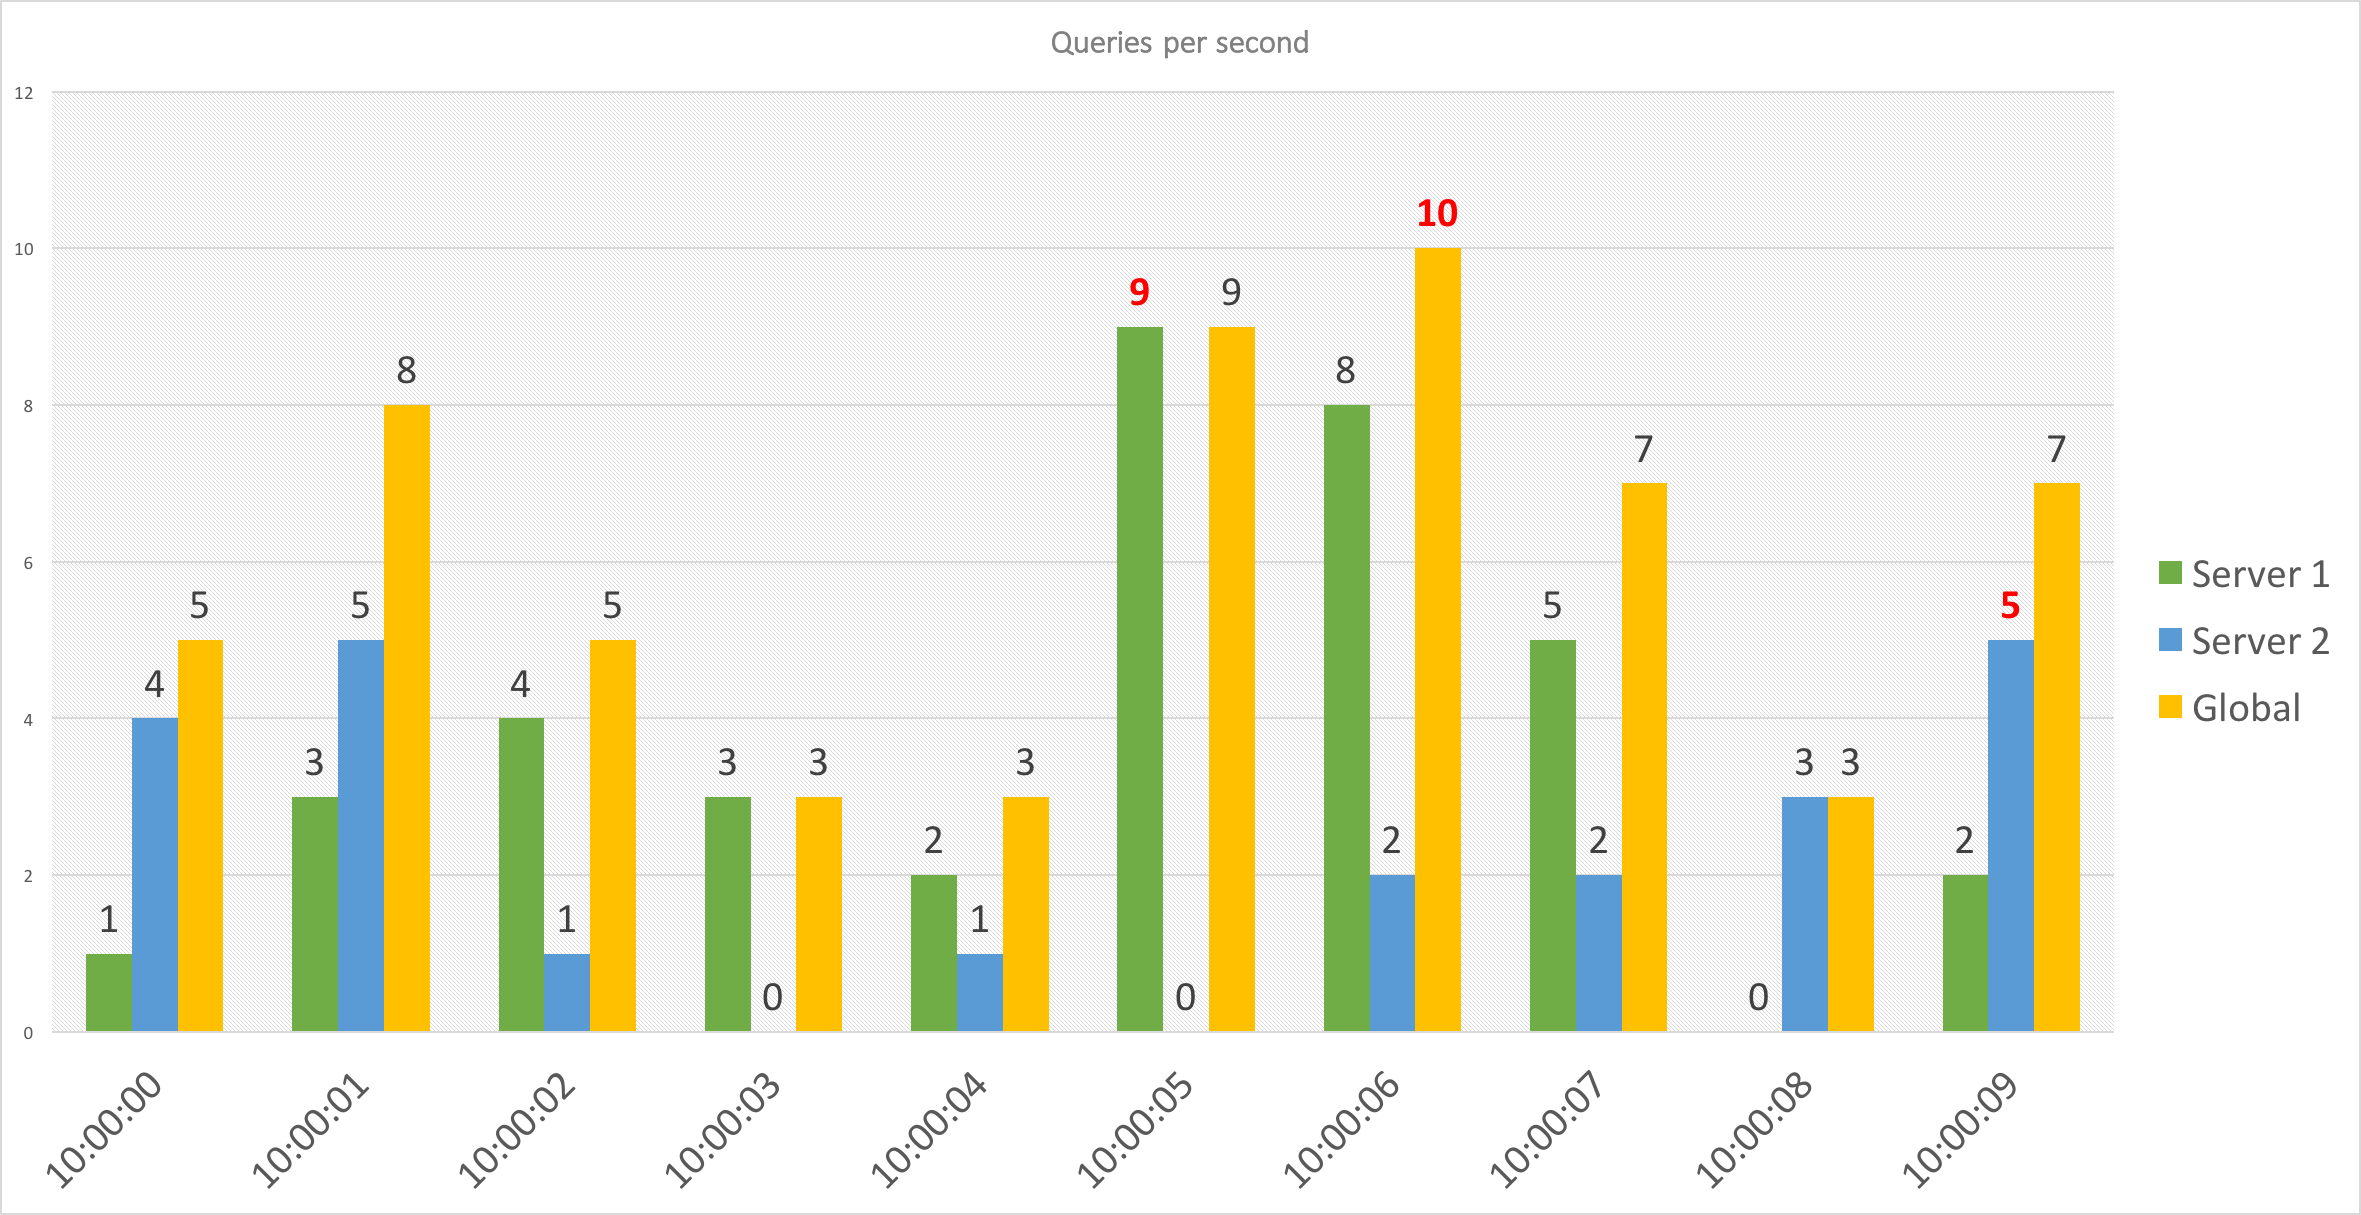
This graph presents a 10-second period. Over this period of time, there will be 2 Max QPS numbers (1 for each server). (In the image, Max QPS = 9 and 5). Note that these numbers do not fall on these same seconds. In general, each server can have a different second in which its QPS is max.
Additionally, the Global Max QPS for all servers might not fall on these same seconds, as you can see in our example, where the Global Max QPS is not a total of these server-based Max QPS. (In the image, Global Max QPS = 10).
Graph Explanation
You can control the view as follows:
- period: by time period (Day, Month, or Year)
- server: by one or more of your servers
Note that each period has a different level of detail:
- For Day, you get the “second” for each hour of the day
- For Month and Year, you get the “second” for each day
The Max QPS graph displays only 1 second, per period, per server; and the second which is chosen is the one that has the highest number of queries. The graph does not do any averaging: it only displays the QPS of the highest second - and ignores the rest of the seconds for that same time period.
Note: What this graph doesn’t show is at which second this occurs. And because of this, it is hard to know what QPS values lie behind the calculation for the Global Max QPS. So, if you have multiple servers which are fairly active, the second that has the total highest QPS will not likely be the same as that of the individual servers.
Find out how we calculate the Max QPS.
