On this page
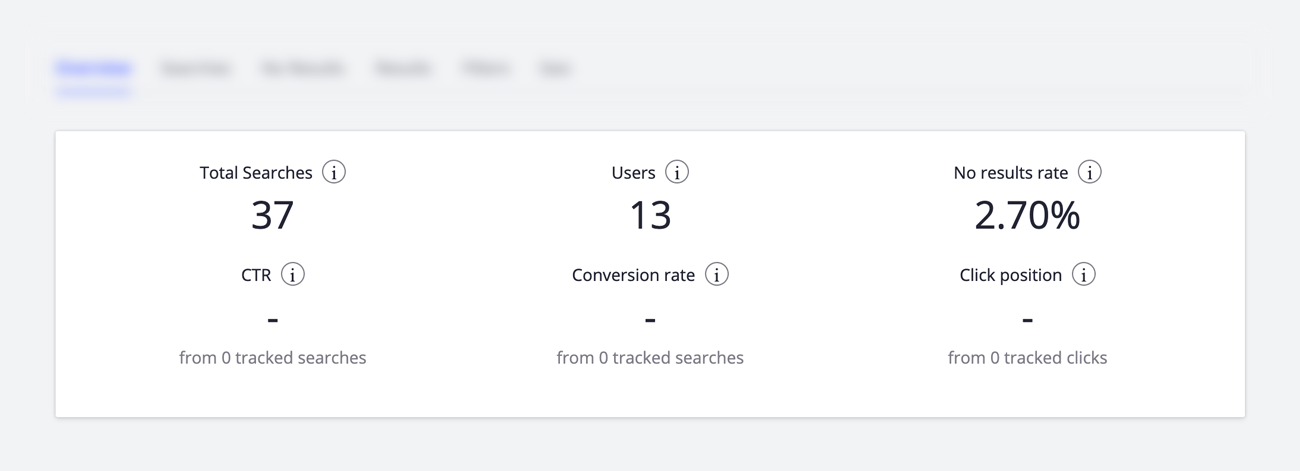
The analytics section of the Dashboard contains a series of reports that give you a full account of your end users’ search-related activity. Let’s look at these in detail.
Dashboard Metrics Explained#

Total Searches#
- How many searches were performed.
- As-you-type searches are aggregated (eg. i → ip → ipa → ipad : count as one search).
- Aggregation time frame : 30 seconds (eg. i → ip → ipa → ….30 seconds… → ipad : counts as a search for ipa and a search for ipad).
- Searches passed with the param “analytics = false” are not counted (the browse tab in the Algolia dashboard includes analytics = false by default).
Users#
- How many unique users performed a search. If you implemented search from your back end, you need to forward the IP address of the user.
- 1 user = 1 IP address.
No results rate (%)#
- Percentage of search that returned no results.
- No results means that the Algolia API sent a JSON response containing no hits.
Click-Through-Rate (%)#
- Percentage of tracked searches (searches with clickAnalytics = true) where at least one result was clicked on by the user.
- From XXX tracked searches : tracked searches are searches passed with the param “clickAnalytics = true”.
- The number of click events received by Algolia / number of tracked searches by Algolia.
Only available after configuring click through and conversion collection.
Conversion rate (%)#
- Percentage of tracked searches (searches when click analytics is enabled) where you signaled to Algolia that it led to a successful conversion (by sending the conversion event with the associated query ID).
- Conversion events and clicks events are independent. A conversion is not linked to a click, only a queryID. Hence you can have conversions without clicks
- Conversion time frame : 1 hour maximum from the search: number of conversion events received by Algolia / number of tracked searches in Algolia
- The conversion window is not only related to conversion, but to all events. Events must be done (not received) within 1 hour of its search. Meaning after a user searches, we will consider the click and conversion provided they are done within the next hour. Furthermore, events must be received by the insights API within 4 days of their occurrence.
Only available after configuring click through and conversion collection.
Conversion is a simple yes/no metric#
We measure whether individual queries lead your users to take a particular action. Let’s say you define the conversion as: “to put an item on the shopping cart”. How often does a search for “t-shirt red dyed” lead to placing an item in the shopping cart? And does “t-shirt” on its own work better or worse?
Several things to keep in mind:
-
You cannot define more than one event as a conversion point: whether you wish to define “buy a product” as the conversion point or “watch a video” - or whatever the choice - this choice becomes the company-wide conversion point for all search-to-conversion analysis.
-
If conversion=buy, and 1 search has generated 10 results, in which 5 of those lead to a buy, this is still considered to be 1 conversion not 5. The goal here is to see if a single search has reached at least one conversion.
Here is a small list of possible conversion points:
- To buy
- To build a wish list, a shopping cart
- To watch a video, read an article
- To make further inquiries, contact support
- To explore further
- To come to the store
- What else? It depends on your business needs. Conversion points are agnostic.
Well-chosen conversions can feed back into your business decision-making. Done properly, Click Analytics should impact:
- The kinds of products and services you offer
- Your inventory
- Diversification of products
- Customer Service
- Levels of Support
- Website UI / UX
Click position#
Average position of the clicks performed on the search results. Smaller values are better
Example: For a query “ipad”, if there was the following clicks:
- 2 clicks on the 1st result
- 1 click on the 3rd result
- 1 click on the 10th result
The click position will be (1 + 1 + 3 + 10) / 4 = 3.75
Lost opportunities#
By looking at click rates and conversions, you can discover and avoid lost opportunities. An example of a lost opportunity is a best-selling items which is not clicked because it appears too low in the search results, or a product that is browsed but not bought.
Lost opportunity analysis shows you how to fine tune your search and your products. It can give you direction in improving your relevance ranking, rewriting product descriptions, and updating your catalog.
Dashboard - Each Tab Explained#

Searches#
- Are items you want to promote visible enough through search?
- Are items you want to demote too visible in search?
- Which categories of products are showing up the most?
- How can you better describe the item?
- What kind of search would you have expected to generate this result? And how did the search even generate this result?
Popular Searches#
- Improving your catalog and inventory. If most of your top searches involve products that fall outside your current product-line, or are under-stocked, you’ll want to review your inventory and catalog. For example, it is clearly business-useful to know what kinds and brands of shoes people are looking for.
- Comparing products. You can see which product features are searched for most, and which features convert the most.
- Re-examining product vocabulary. Which words do your users use? You can align their vocabulary with that of your database. An example of this would be sofa vs. couch: if “sofa” is typed more often than “couch”, your database needs to adapt to this usage to support both sofa and couch equally (by using additional attributes or synonyms, for example).
Your popular searches may contain the <empty query> search. With some coding, you can prevent <empty query> from showing up in your analytics.
No results#
- Identify missing items in your catalog
- Synonyms that you need to add
- Improve your filters
- The “overall no result” rate gives you a global barometer of your search implementation
Results#
- Are your results desirable? You can see the most common results for any given set of search terms. Are these the results that you would have expected? Do you want these results to show up? Is the order of the results correct? Is there an item missing?
- Are your filters useful? You can examine the filters used in combination with searches. Is filtering on color more popular with shirts and dresses than with pants? What does filter usage say about your relevance settings? Can you better align your relevance with the most commonly-used filtering?
Filters#
Filter attributes: See which of your filters are consistently used (this includes your optional filters). You can use these analytics to configure your filters better. For example, if your users are using your size and color filters but not your brand one, then you can remove your brand filter or display it lower on your page.
Filter Values: The same for filter values: if the colors red and yellow are used more often than purple, you can adjust your inventory by stocking less purple items, or adjust your index settings by favoring or promoting red and yellow over purple.
Geo Data#
Metrics that tie search to location can help you learn about who your users are and where they come from. Geo data can help you assess the search and business needs for each country. Additionally, linking performance / latency with user location can help you better choose where to place your servers and DSNs.
